The Edit tab allows you to manipulate interrogation results in complex ways.
Quickstart: relative frequencies
Before diving into the many features in the Edit tab, we’ll start small. Let’s use Edit to turn absolute frequencies to relative frequencies. Just follow these steps:
- Under
To edit, select an interrogation that you performed previously. Its results and totals branches will be displayed on the right.
- Select
results to edit its results, rather than its totals.
- Under
Operation, select %.
- For
Denominator, select Self, and then the totals branch.
- Under
Edit name, pick something memorable.
- Hit
Edit.
This will generate a relative frequency version of your original interrogation, and store it to memory under the name you chose. You can then do all sorts of things with it:
- Select it as the
To edit data for more complex editing
- Manually alter the values in the spreadsheets and hit
Update interrogation(s)
- Head to the
Visalise tab to plot the results
- Go back to the
Interrogate tab and use the Previous and Next buttons to see the results in a larger window
- Navigate to
Menu → Manage project and:
- Save it permanently to
project/saved_interrogations
- View the options that generated it
- Rename it
- Export it to CSV
- Remove it from memory
- Delete it from
project/saved_interrogations
You’ll notice, however, that we just skipped over a lot of options and buttons. In the sections below, editing is outlined in more detail.
Selecting data to edit
You can select any interrogation or edited result to edit. After this, you need to select a branch, either results or totals. These correspond to the two spreadsheets in the Interrogate tab. Some kinds of searches do not generate both branches, however: Count tokens, for example, produces only a totals branch.
Operations and denominators
A very common task is to turn absolute into relative frequencies. To do this, you simply select '%' as the operation, and self totals as the denominator, as in the Quickstart example. To calculate a ratio, rather than a percentage, you could use the ‘÷’ operator. The subtraction operator may be a useful way of removing a false positive result.
The other operations are:
Combine: join two interrogations, aggregating any column that appears in both.Keywords: perform log-likelihood keywording%-diff: perform percentage-difference keywordingrel. dist.: To use on Interrogations produced with the Distance from root option
Keywording is treated in more depth here.
Relative frequencies: a more detailed example
Perhaps you are interested in the most common plural nouns in each subcorpus of your corpus. Your subcorpora, however, vary quite a lot in size, so you think relative, rather than absolute, frequencies are more appropriate.
You decide you want to get the relative frequency of plural nouns compared to:
- All plural nouns
- All nouns
- All tokens
To do this, you need to go back to the Interrogate tab and perform three interrogations, all using the Trees search type. First, you use Get words with a query that will match plural nouns. You give the interrogation a memorable name: list plural:
/NNP?S/ < __
Second, you select Count as the return value, and define a query to match any noun (name: count noun):
/NN.?/ < __
Finally, still using the Count tokens option, you select the preset query Any, which will match any token (name: count token).
Now, back in the Edit pane, you perform three separate edits, creating three different spreadsheets:
| Data |
Branch |
Operation |
Denominator |
Branch |
list plural |
results |
% |
Self/list plural |
totals |
list plural |
results |
% |
Count noun |
totals |
list plural |
results |
% |
Count token |
totals |
corpkit’s ability to perform these kinds of operations means that you can generate useful and appropriate statistics from your data. Why show passives as a percentage of all words, when you could show passives as a percentage of all clauses?
Results branch as denominator
So far, whenever we’ve picked a denominator, we’ve selected its totals branch. If you use a results branch as a denominator, things get a little more complex. Rather than being divided by the total from that subcorpus, each entry will be divided by the total occurrences of that particular entry in the denominator data. This is a hard thing to explain, though. It’s easier to understand this feature through an actual use-case:
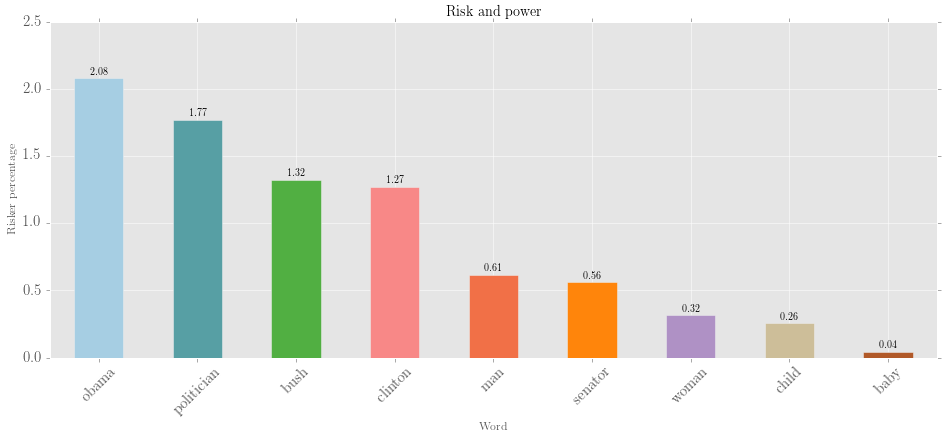
Calculating risk and power
In an investigation of risk language in The New York Times, exploratory analysis suggested that people in positions of power are often the ones doing risking. Politicians risk votes, but shoppers don’t seem to risk fatigue. This seems like an interesting thing to measure … but there is a problem. Some common nouns, like person, are much more frequent than Obama or senator. So, if we try to tally all riskers, person keeps coming out on top.
To work around this, the investigator performs two searches. The first gets Participants in the corpus. The second gets just Participants who are the actors in risk processes:
| # |
Data type |
Search option |
Query |
Function filter |
Lemmatise |
Name |
| 1 |
Dependencies |
Get tokens by role |
LIST:PARTICIPANT |
|
True |
participants |
| 2 |
Dependencies |
Get "role:dependent" |
\brisk.* |
LIST:ACTOR |
True |
riskers |
We also head to the Wordlists feature and define a list of people of interest, called PEOP:
obama
bush
clinton
politican
senator
man
woman
child
baby
The two lists can then be mashed together in the Edit tab:
| Data |
Branch |
Operation |
Denominator |
Branch |
Sort |
Just totals |
Just entries |
riskers |
results |
% |
participants |
results |
Total |
True |
LIST:PEOP |
The visualised output:
 </div>
</center>
... Great! As expected, though *person* might be a much more common word than *politician*, politicans are far more likely to be doing risking.
## Combining results
You can use the `combine` operation to add two results together. By default, this happens on the y axis. If you have multiple columns with the same names, these will be aggregated.
## Sorting
When working with multiple subcorpora, sorting becomes a very powerful feature of *corpkit*. Aside from very normal kinds of sorting (by total, by name), you can also sort by *increase*, *decrease*, *static* or *turbulent*.
*corpkit* does this using [`Scipy`'s *linear regression* function](http://docs.scipy.org/doc/scipy-0.14.0/reference/generated/scipy.stats.linregress.html). Essentially, a straight trend line is calculated for each entry in the data. By measuring the angle of this line, we can find out which results increasingly or decreasingly occur across the dataset.
If you tick `Keep stats`, you'll be able to see the `slope`, `intercept`, `stderr` and `p value`, where the null hypothesis is that there is no upward or downward slope. `Remove above p` will automatically exclude results not meeting the standard.
## Keywording
If you select the `keywords` operation, you can get log-likelihood keyness scores for the the dataset of interest, compared with the denominator as a reference corpus. When doing keywording, the reference corpus can be either:
1. a results branch of any interrogation
2. A dictionary from the `dictionaries` folder: either the BNC (included), or one you made yourself using the `Save as dictionary` button in the `Interrogate` tab.
Using `Self`-`results` as denominator will determine which words are key in each subcorpus. Each subcorpus is dropped from the reference corpus in turn in order to calculate these values.
Tip: Negative keywords exist, too: try sorting by inverse total to find out which words are uncommon in the target data.
You can also use `%-diff` to calculate keywords via percentage difference, an alternative keyword algorithm.
## Skipping, keeping, merging
You can easily skip, keep or merge particular entries and subcorpora. For entries, you need to to write out some criteria. For subcorpora, you can select from the list.
When writing out entries to keep/remove/merge, you can supply either:
1. A regular expression to match: `^fr*iends?$` will match `fiend`, `fiends`, `friend` and `friends`.
2. A list: `[fiend,fiends,friend,friends]`
Note: Special queries work here, too. If you searched for process, you could keep only verbal processes by using LIST:VERBAL.
If merging either subcorpora or entries, you may want to provide a new name for the merged item. If you leave this field blank, the first few entry names are joined together with slashes as the new name.
Merging entries is a powerful way to do thematic categorisation: you could merge the names of illnesses as `Illnesses`, and the names of treatments as `Treatments`. You could then edit the edited results, keeping only those two.
## Replacing names
You can change the names of entries after they appear. One way to do this is to click the spreadsheet, make changes, and click `Update interrogation(s)`. Another way is to use the `Replace names` boxes. The box on the left takes a regular expression as a search pattern. It will look in every entry name matching the expression, and replace it with whatever is in the box on the right (leave blank to simply delete the found pattern). Duplicate entry names are then merged.
## Other options
| Option | Function |
|---|---|
| `Keep stats` | When calculating slopes, keep these in the edited data, and show them in the spreadsheet windows |
| `Remove above p` | A null hypothesis is that entries are equally frequent in each subcorpus. When calculating slopes, remove any entries with `p` above `0.05` |
| `Just totals` | Combine every entry before processing |
| `Transpose` | Flip rows and columns (subcorpora become entries, etc.) |
| `Spelling` | Convert or normalise English |
| `Keep top results` | After all other editing and sorting, return only the top n results |
## Naming your edit
As with interrogations, it might be helpful to give your edit a name, so that it can be more easily identified. You don't have to do this, however.
## Performing an edit
Once all your options are set, just hit `Edit`.
Editing is generally very fast, but very large interrogations, combined with many different kinds of edits, may slow things down a bit. Using results, rather than totals, as a denominator will generally take a little longer.
Note: You can use Help → Save log after performing an edit to get some information about what was performed.
If you'd like to see the results in a bigger window, head back to the `Interrogate` tab and use the `Previous` and `Next` buttons to bring up your edited results.
## Next steps
After you've created a set meaningful results, you can head over to the `Visualise` tab to display your findings in an engaging way.